


The charts and graphs below offer a detailed in-depth look at Bermuda’s current and cumulative Covid-19 statistics, with the eight charts below — three of which are interactive — providing comprehensive information.
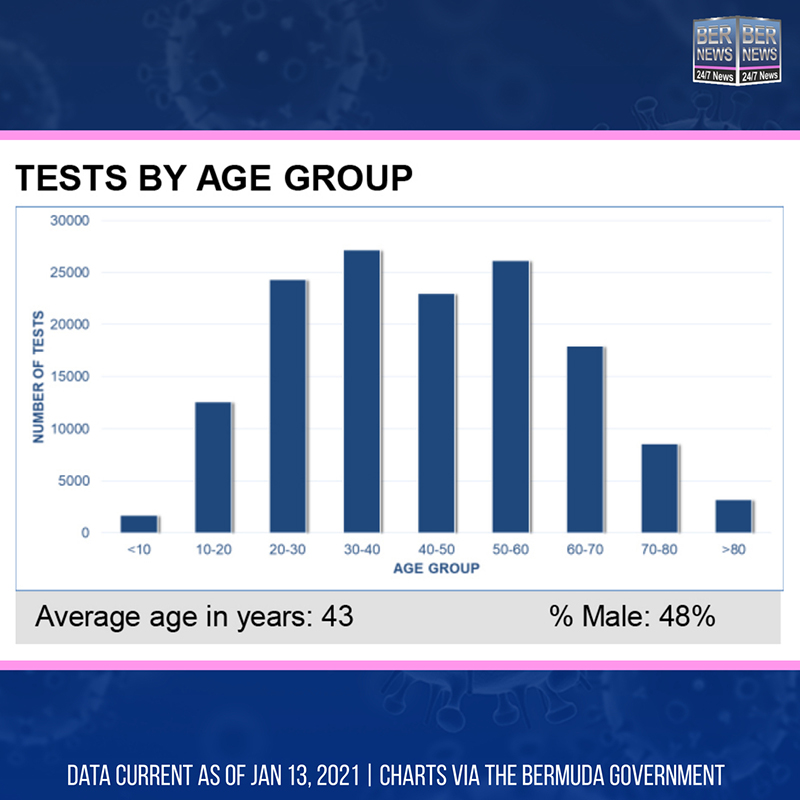
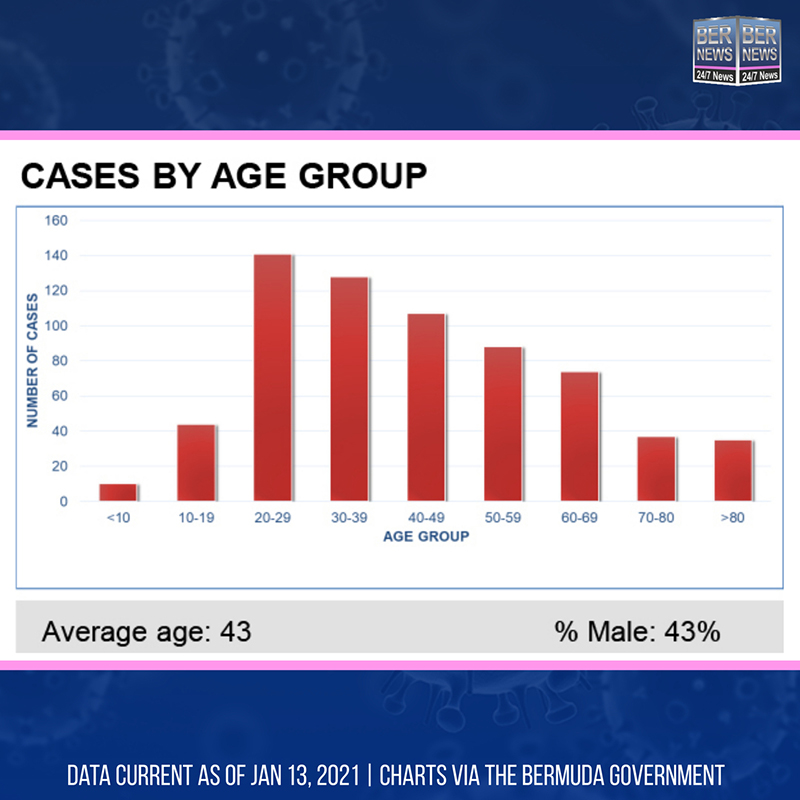
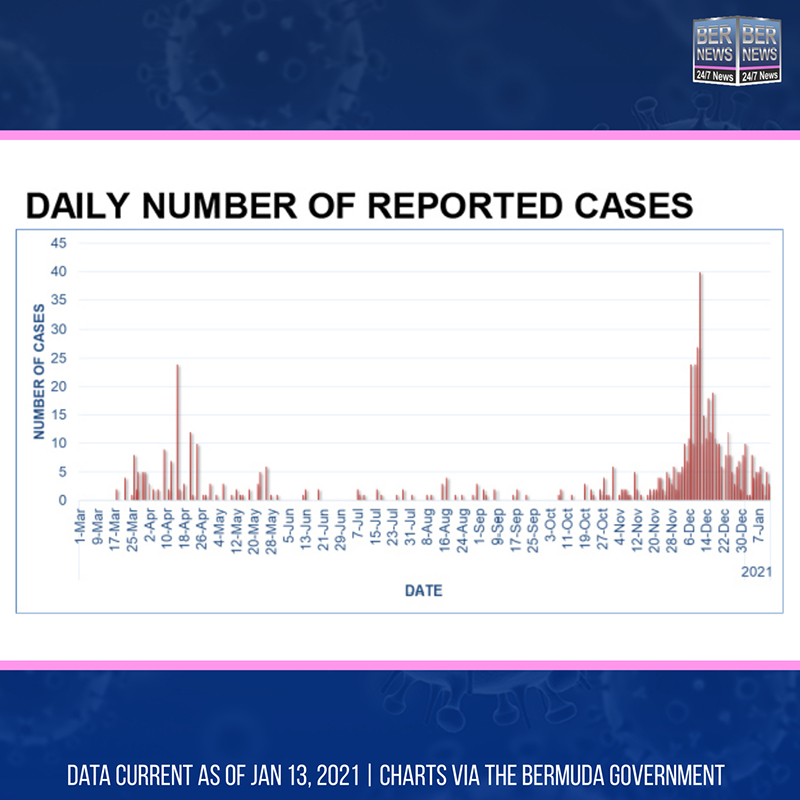
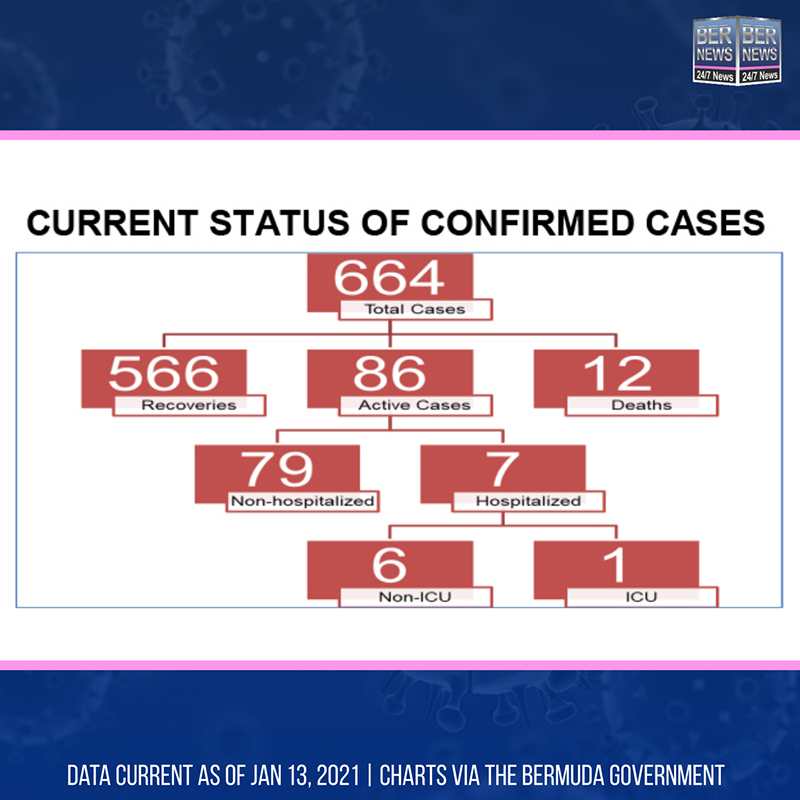
The top five charts are via the Government and provide information on the current condition of all confirmed cases to date, age of all cases and tests, transmission classifications, and daily reported cases, with the information valid as of January 13th, 2021.
The next three charts are compiled by Bernews and show a look at statistics spanning from March 2020 to current day, and they are interactive; for example, you can click the ‘recovered’ category [or any other category] to remove that line and can also hover your mouse [or finger if on a mobile device] to see the numbers for a given date and the last chart offers the ability to change the order the figures are shown.
For a full look at more interactive results and comprehensive information, including all Government data spanning back to March 2020, please visit our dedicated pandemic website at BermudaCovid.com as we cannot add all the features from that website to main Bernews for technical reasons, however the dedicated Covid website does offer additional features.
Bernews interactive chart of test results, click categories at bottom to add/remove
Bernews interactive chart of total tests, click categories at bottom to add/remove
Test results spanning back to March, scroll to view more; it is interactive, if you click on the categories [Date, Recovered etc] on the chart below you can change the order it shows.


