


The Government has released the modelling numbers for the Covid-19 pandemic, with the Minister of Health stressing that the numbers cannot be interpreted as predictions of what will occur, as the “point of the model is not to predict the future, but to influence it – to help us prepare for it and choose a good course of action.”
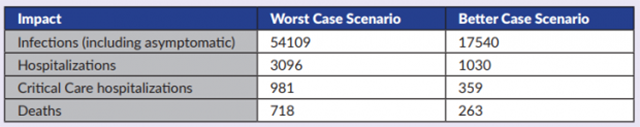
According to the document, infections – including those which are asymptomatic – could number at 54,109 in a worst case scenario, with the better case scenario numbering 17,540. Regarding hospitalizations, the worst case scenario could see 3,096 in hospital, with the better case scenario being 1,030.
Regarding critical care hospitalizations, the worst case scenario suggests a number of 981, while the better case scenario is 359; in the case of deaths, the worst case scenario is 718, while the better case scenario is 263.
At this evening’s [April 24] press conference, Minister of Health Kim Wilson said, “The country has been following the developments with COVID trends locally and internationally for the past few months, and today I’m pleased to present to you the modelling data generated by the Ministry of Health’s Epidemiology and Surveillance Unit with guidance from Public Health England and based on modelling done by Imperial College London.
“As the COVID-19 pandemic evolves and more information becomes available, the modelling will become more refined and these numbers I am presenting will change. The data I will present to you today is as of 20 April 2020.
“It’s crucial to know that the numbers generated through this or any model cannot be interpreted as predictions of what will occur during the current COVID-19 pandemic. Rather, they must be treated as estimates of what might happen, based on the assumptions used in generating these estimates and the modelling strategy used.
“Therefore, it is important not to get fixated on the exact numbers. The point of the model is not to predict the future, but to influence it – to help us prepare for it and choose a good course of action.
“Likewise, the worst case scenario is a planning tool. It provides a ceiling figure for the maximum foreseeable impacts which would occur if the COVID-19 outbreak was uncontrolled.
“Some of these numbers may sound scary, but recognize that the worst case scenario is what Bermuda could experience with no interventions or public health measures. Bermuda has already put many such interventions in place ranging from social distancing to the shelter in place that we are currently in.
“So first, I will talk about the worst case scenario for Bermuda. The worst case scenario sees potentially over 54,000 [54,109] infections [including asymptomatic infections]; over 3,000 [3,096] hospitalizations; 981 persons requiring critical care; and 718 deaths.
“The peak for this case scenario would be 22-25 May, but again, remember that this would be the situation if no interventions or public health measures were put into place.
“The numbers are higher than what might be expected because the severity of COVID-19 is age-dependent, with more severe outcomes seen with increasing age and a notable increase seen in 80+ year olds, and Bermuda has an older age-profile. Both the age structure and the mortality rates for Bermuda were incorporated into the model.
“Bermuda’s better case scenario, which is what may occur if interventions are effective, potentially sees us with 17 and half thousand [17,540] infections [including asymptomatic infections]; just over 1,000 [1,030] hospitalizations; 359 patients requiring critical care; and 263 deaths.
“The peak would be 6-15 September. Our aim is to do even better than this. Local data and intelligence is crucial in assessing what is happening locally and the impact on healthcare capacity.
“The modelling was done using a SEIR model [Susceptible, Exposed, Infected, Recovery] with numerous assumptions including: no immunity in the population [100% susceptibility], that symptomatic individuals are more infectious than asymptomatic individuals and that upon recovery, individuals are immune to re-infection, at least, in the short term.
“It was also assumed that that the average duration from onset of symptoms to hospitalization is five days for those requiring hospitalization, that 30% of those that are hospitalized will require critical care, and that the overall average duration of hospitalization is 10.4 days.
“In the absence of a COVID-19 vaccine, public health measures – also-called ‘non-pharmaceutical interventions’ or NPIs –are the best defence against COVID-19. These interventions are aimed at reducing contact rates in the population and thereby reducing transmission of the virus. These interventions include case isolation, quarantine, social distancing of those over 70 years of age, social distancing of the entire population, and closure of schools.
“The effectiveness of any one intervention in isolation is likely to be limited. Multiple interventions used in combination may be required to have a substantial impact on transmission. Optimal implementation of these interventions could reduce peak healthcare demand by two thirds and deaths by half.
“To avoid a rebound in transmission, effective interventions will need to be maintained, at least intermittently, for up to 18 months or more, depending on how immunity develops in the population, either herd-immunity of through vaccination.
“There are very large uncertainties around the transmission of this virus, the likely effectiveness of different policies and the extent to which the population spontaneously adopts risk reducing behaviours.
“Although it is unknown how the pandemic will continue to evolve, three outcomes can be envisaged:
- Complete interruption of human-to-human transmission
- Recurring epidemic waves [large and small]
- Continuous low-level transmission
“Based on current evidence, the World Health Organization states that the most plausible scenario may involve recurring waves interspersed with periods of low-level transmission.”
The full coronavirus modelling slides follow below [PDF here]:
The full modelling summary follows below [PDF here]:


