


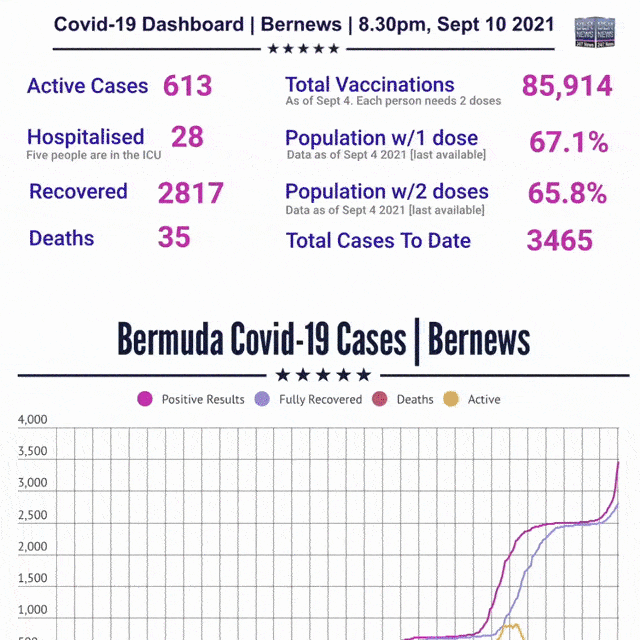
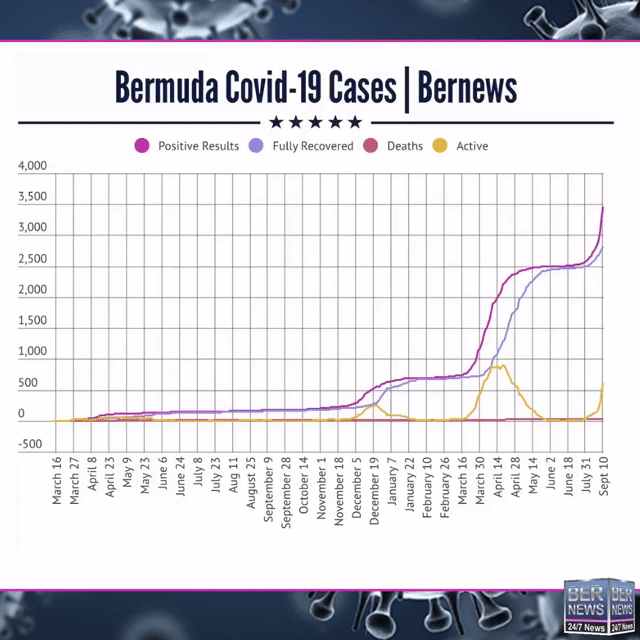
To provide an easy ‘one glance’ look at the key data, we added a new page here on our dedicated Covid-19 website BermudaCovid.com showing all the various charts together.
The charts, compiled by Bernews, cover a wide range of data including test results spanning back to March 2020, total tests, positive cases, negative cases, deaths, active cases, total vaccinations, vaccinations by gender, vaccine percentage, and more.
The one page of charts is designed to provide an easy to access overview of all the data since the pandemic began, and if you are seeking more detailed data, there are individual pages, for example the vaccination page offers charts, weekly information, timelines and more.
As there are over 1500 data points added and some are large numbers [eg: we have done almost 1/2 million tests] it can be confusing, however all the charts are interactive, and you can hover your mouse or touch a point on a touchscreen phone/tablet to adjust the lines and/or show additional detail.
At over 2,000 pages, the BermudaCovid.com website is now the largest repository of coverage of the Covid-19 on the island and provides a thorough archive of Bermuda’s handling and response to the virus, with an aim to create a strong historical record that can be accessed for years to come. As always, BermudaCovid.com is a work in progress, and it will be continuously improve and expanded as time passes.


